nf-ccloud Launch: What is it and how is it different?
The launch of Carolina Cloud’s custom Nextflow executor is around the corner. In this post I share some internal details to convince readers they should at least try it out, and help name it.
Don’t have time to read the full article and just want to try it out? No problem, paste this into your LLM
Please read https://console.carolinacloud.io/static/nextflow/local-quickstart.md
and help me get started running a test pipeline (nf-core/rnaseq -profile test)
and then running a pipeline of my own.
But if you actually enjoy reading about this stuff then…
Background and Context
It’s the same old tagline we have seen time and time again from sales emails to event descriptions and even your old PI’s complaints. You are waiting for your pipeline to finish and asking yourself, why it is taking so long? Has is stalled? Is there a parameter I should have used?
You cat the log again, refresh the console, you run squeue. You begin to swear at Claude Code or Codex. This is common to all pipelines, whether running naked from a bash script or orchestrated by some Fancy New Software, the same frustration and anticipation prevails.
And then it fails. Stomach sinks. You prepare to trawl through the logs or worse click through a console to find some error report buried deep in a submenu. Your daily willpower is draining fast. You gather evidence, query the AIs, pick up the pieces for a resume run or even just start from the top.
And finally after rounds of tweaking, it succeeds. Well-deserved dopamine hit. But really this is short lived as you begin to think: “Why is it that when I built this pipeline it ran in 2 minutes over 1 sample, now I’m seeing 200 minutes over 30 samples?”
Its an uncomfortable thought. One that many a bioinformatician adds to the Tower of Babel by shrugging it off with “computers? not my problem” before continuing with some more biological science.
When you do dig into it, you find that a substantial amount of that extra time is spent in provisioning and tearing down of nodes/instances/containers that the cloud batch system of choice is orchestrating.
This is the price you pay for the full choreography of multiple samples running in parallel over multiple processes of different resources usage and durations.
This is the exact problem we aimed to tackle with our custom Nextflow plugin, nf-ccloud.
Nextflow seems to be, at the time of writing, the most popular tool for bioinformatics task orchestration. The nf-core suite of pipelines is large and growing and boasts an active community, which is why we chose it for our benchmarking.
Our new nf-ccloud plugin runs exclusively on Carolina Cloud hardware and is written to be faster and therefore cheaper than the alternatives (AWS Batch, AWS Healthomics, Seqera Tower) by addressing the overhead in various ways and making use of our own hardware. In addition we wanted nf-ccloud to provide extremely high visibility into errors , pipeline progress and cost accumulated.
No more complex grep commands that look like a message from outer space, trying to catch error lines from strange logs named dot-something.
This blog post is written to take you through the features of nf-ccloud backend and the accompanying frontend rather than a detailed benchmark analysis of it against the competition. That will be in a separate post as it needs it own stage. This post is about what we did and how we did it.
The UI
This is where things start to look both pretty and fun. Prepare for a stream of screenshots but it is the easiest way to move through this like Greased Lightening and not miss a cool feature. To see a full, public version and have a good click around go here.
Navigate to the the Nextflow section of the console to see all your pipeline runs, whether started from one of your Carolina Cloud head containers or from any external machine with a scoped pipeline API token (minted from the console).
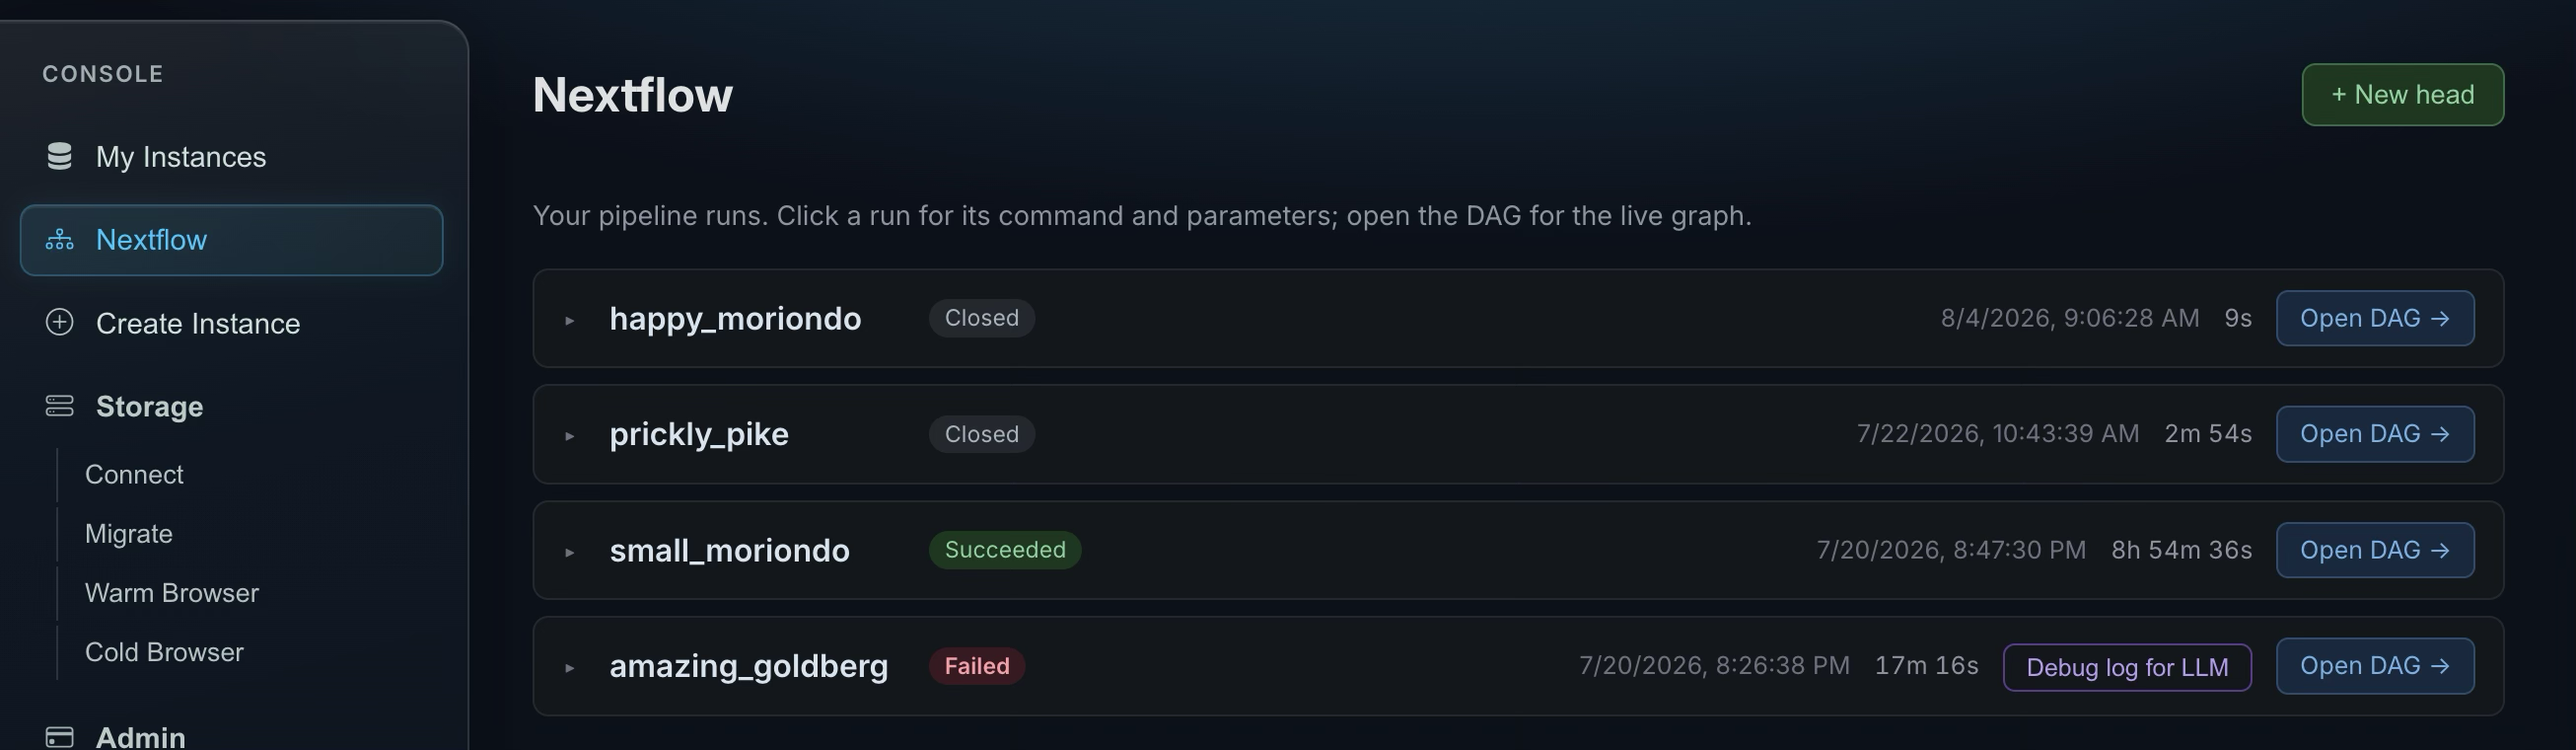
The Nextflow default run names range from benign to confusing to revolting
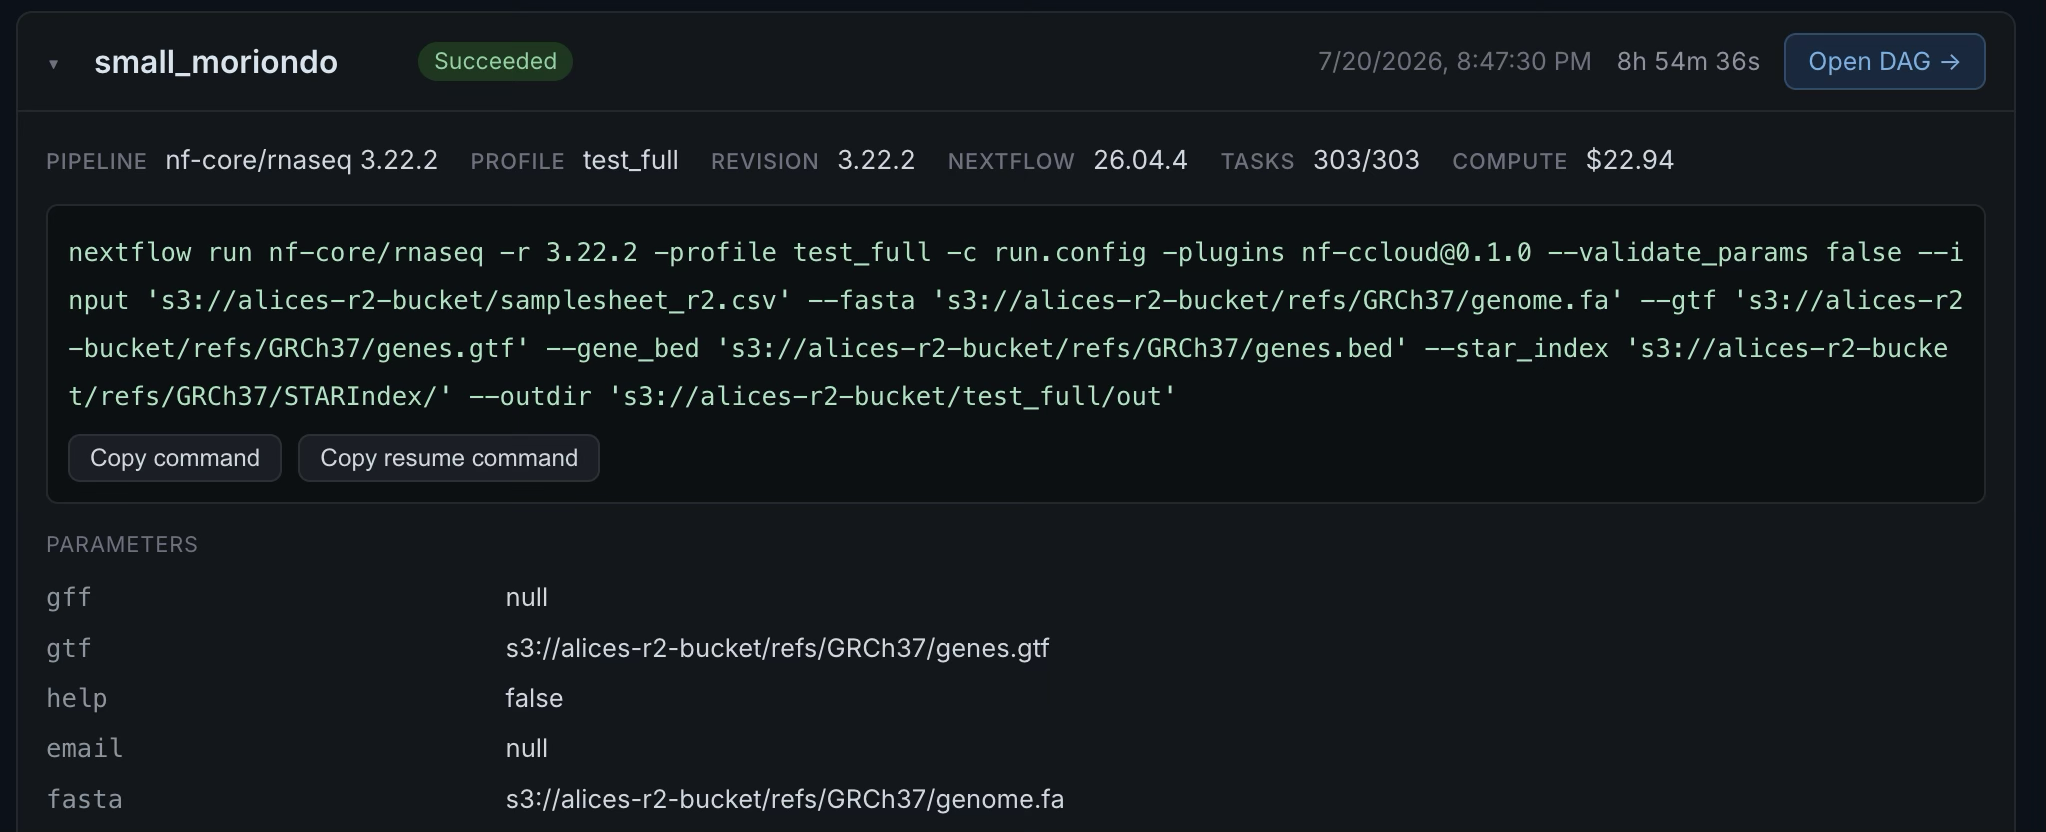
Drill down into each to get lower level details including cost (which is, as per our philosophy, always upfront transparent) and copy buttons for rerun or resume commands.
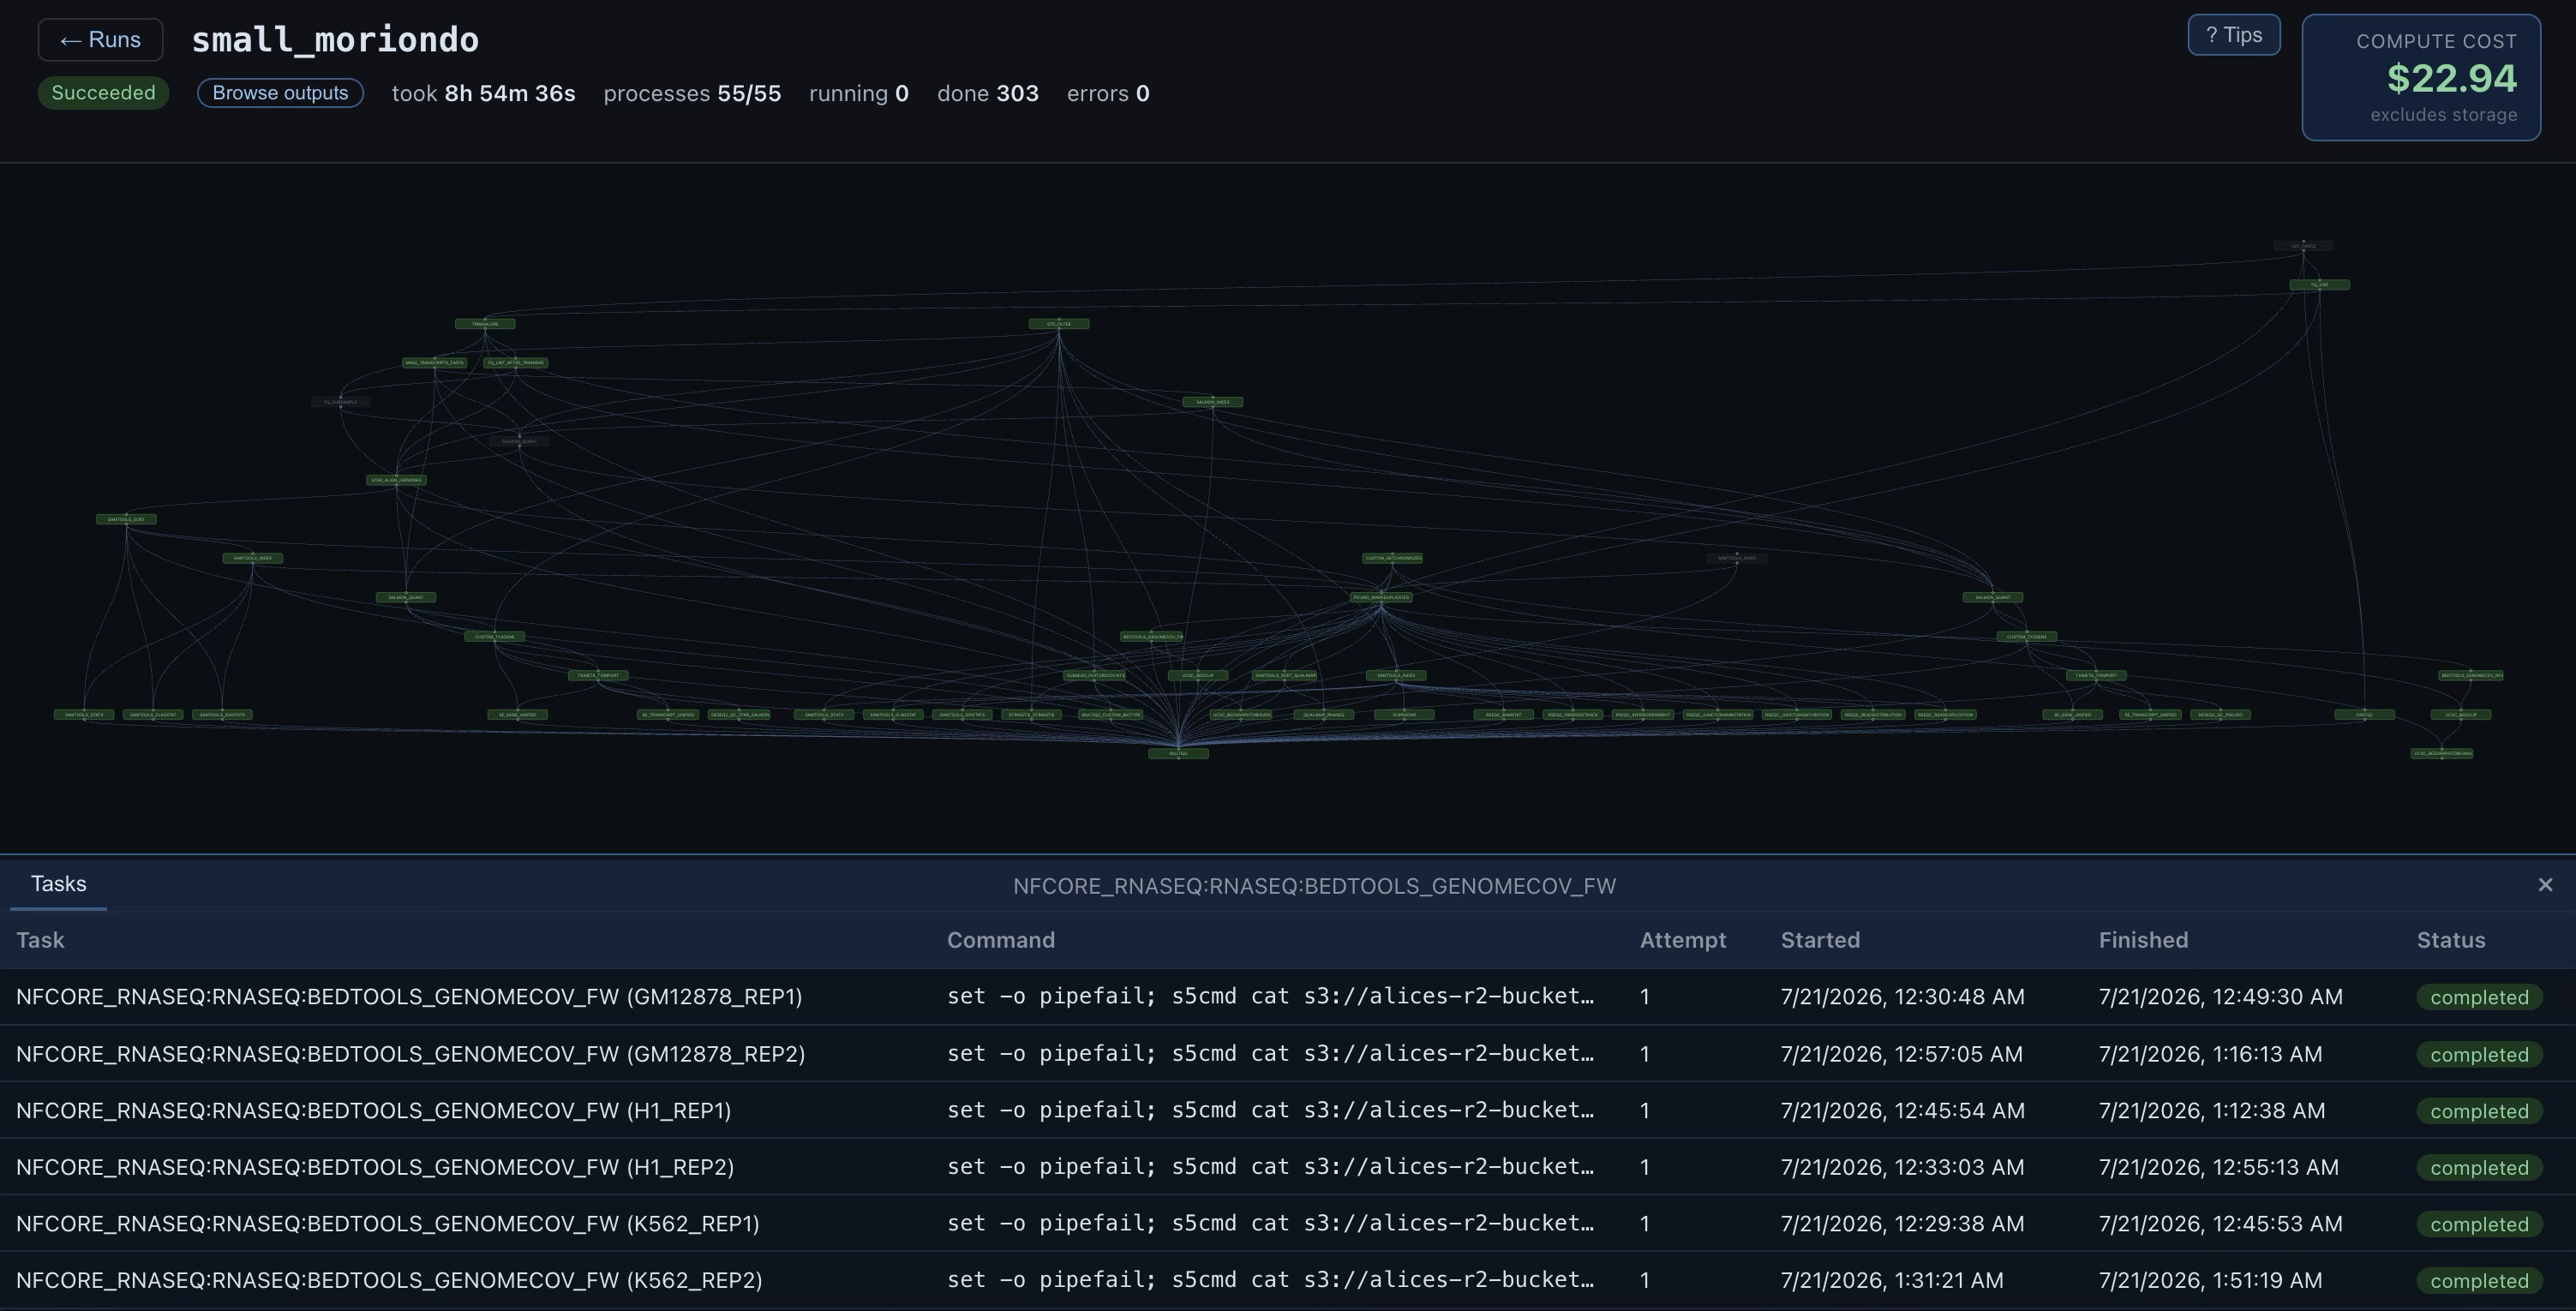
Click ‘Open DAG’ and get a full rendered interactive view of your pipeline. Along the top you see live metrics as a pipeline is running including a cumulative live cost (there it is again). Scroll, zoom and click into processes on the graph to the task list in that process, labelled running, failed, cached and completed.
Then go one level lower; click into a task to open a task tab. See live metrics per task including running/peak resource usage, per task cost, the work dir path and output files.
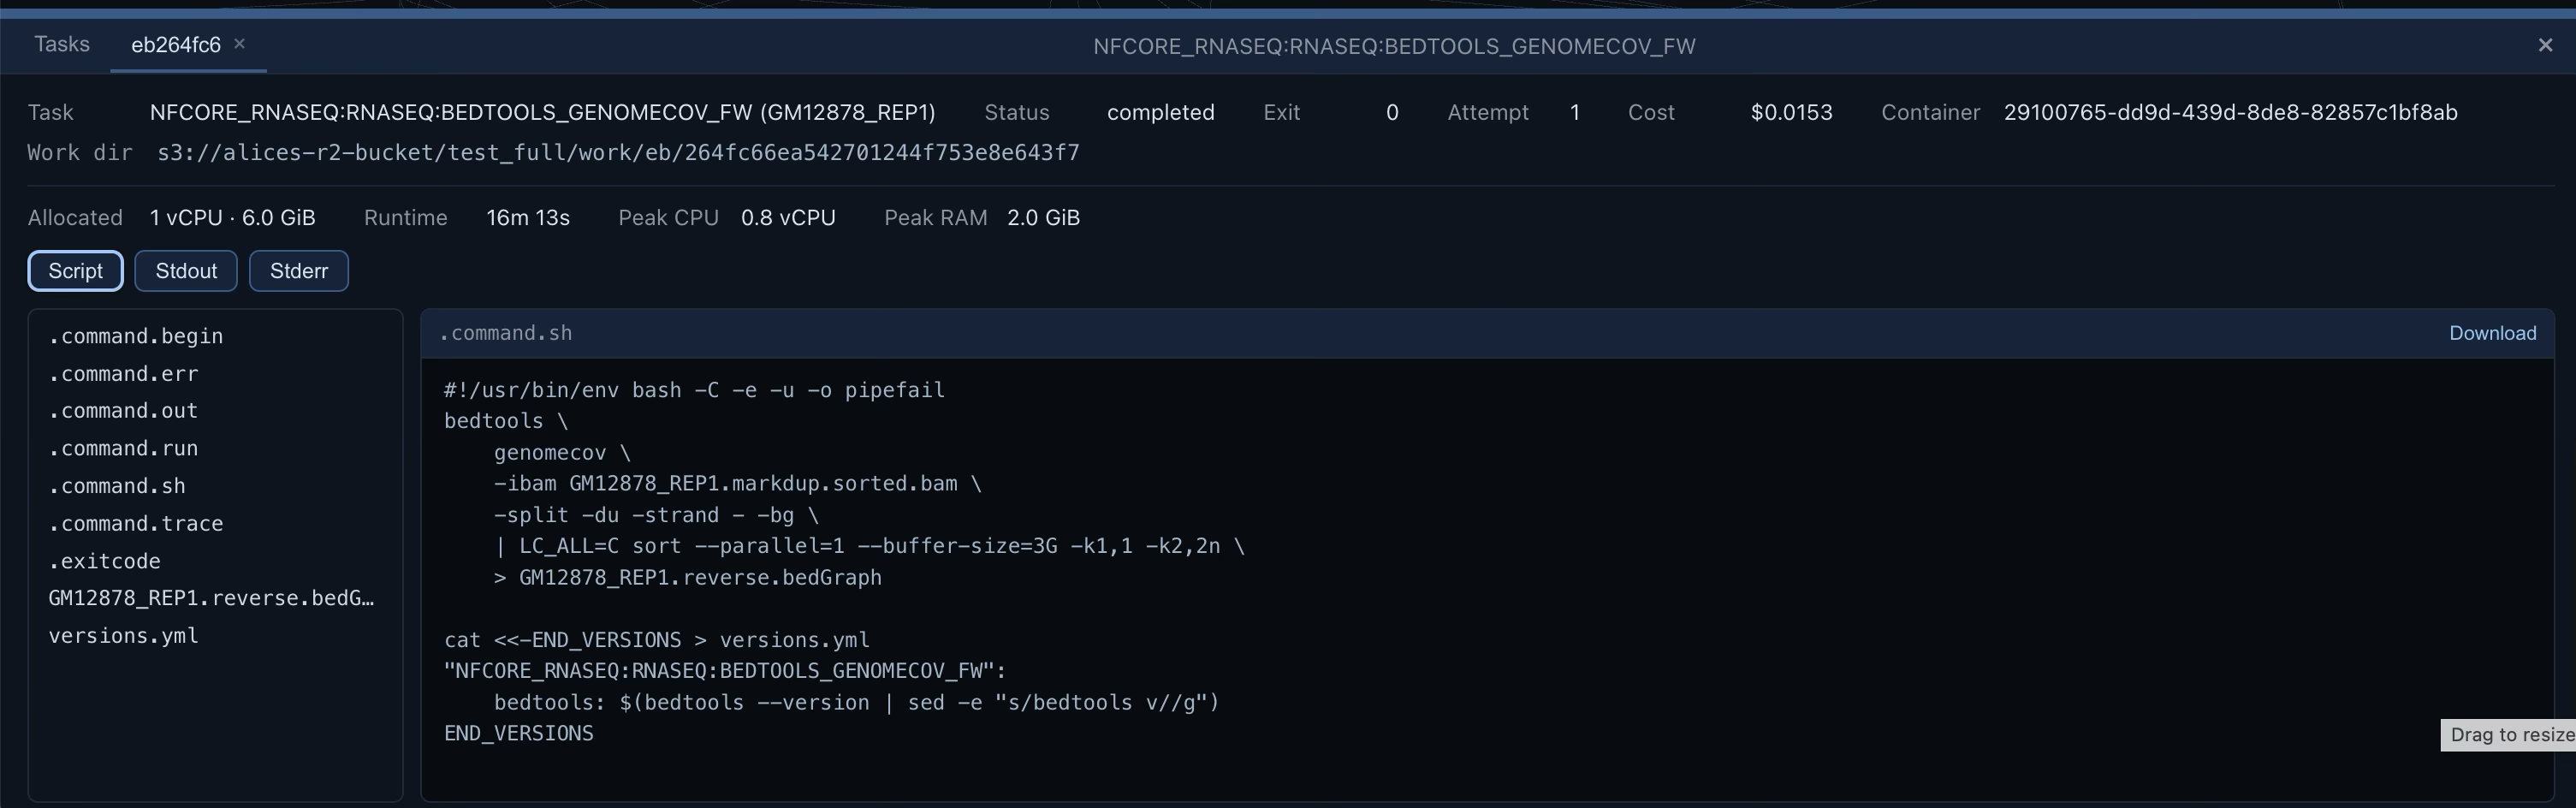
I’ve just picked out some highlights here and there is much more to explore. The visibility we bring to a pipeline with the UI is unparalleled. As far as we know, no other cloud batch service shows a pipeline to this level of detail, particularly the interactive DAG view.
The Backend Engineering
As is often the case in tech, the vast majority of our “impressive features” are just publicly-documented docker features and API endpoints so I feel no need to be particularly secretive. At a high level, nf-ccloud manages a “warm pool” of worker containers that receive tasks from Nextflow. Each worker container is a gVisor-hardened docker container.
The Warm Pool
Most cloud batch systems treat one task in isolation by picking an instance, booting it up, running the task and then throwing it away. This adds overhead time on a per task basis racking up wall-clock time, especially for a typical nf-core pipeline with hundreds of small to medium tasks.
nf-ccloud runs a pipeline using a pool of containers that stay alive for the duration of the run. Instead of provisioning a pool worker per task, the pool reshapes itself around the DAG (directed acyclic graph):
-
For our pool of workers we use containers rather than VMs, hardened for security, so we benefit from sub second cold start times and the warm pool initiates fast.
-
Workers are then reused between tasks, resized in resources for whatever is needed next. This resize again takes less than a second, completely cutting out time wasted (and paid for) on task spin up and spin down.
-
Workers are sized to exactly what the process declares, the cpus, memory, and disk in the pipeline directives, not the nearest item on an instance-type menu. Ask for 6 vCPU and you get 6, and pay for 6. No rounding up to the nearest instance-menu T-shirt size. Made for athletic builds. You don’t have to declare before-hand from that menu what you want. You don’t get automatically placed with an r8a.4xlarge (16vCPU/128GiB RAM) for a task that needs 72GiB of RAM and only 6vCPUs. It’s like having your tuxedo fitted by an attentive tailor rather than manufactured in a sweat shop.
-
Between tasks a worker shrinks to a minimal idle floor, so the pool can afford to stay warm. In fact, idle time at 1vCPU and 1GiB of RAM across an entire pipeline costs close to nothing.
-
When the pool genuinely does need to grow, again we benefit from that sub second spin-up time. Scaling up mid-run is a non-event rather than a stall.
-
Lastly, when the run goes quiet, the pool is pruned automatically.
The result is that a task starts in a few seconds instead of a few minutes. Thanks to our friends at Flock Bio, an independent beta tester, who measured a median of 3.6 seconds on Carolina Cloud vs ~180 seconds on AWS Batch on their task start times (spin-up plus task dispatch). That’s a 50× reduction in per-task startup. More on this in the next blog.
Staging that isn’t a bottleneck
Nextflow’s model is that every task reads its inputs from the shared work directory. On a cloud executor that usually means object storage so when a task finishes and its successor starts, the successor downloads the file that was written moments ago. During a fan-in step, the same reference genome gets pulled down independently by every single worker that needs it. The data is already sitting on a local NVMe drive a few feet away; the pipeline just has no idea.
nf-ccloud keeps a per worker local NVMe bounded cache where output files are stored. When a task writes to that cache we record which worker produced it and when a downstream task needs that file as input, the scheduler prefers to place it on the worker that already holds it. We call this a “locality hit”. The whole network download is skipped. For a pipeline like nf-core/sarek, with a BAM file chain across 5 processes, this can save a huge amount of time and potentially terabytes crossing the network. On the rnaseq test_full for example we see dozens of “locality hits”, saving substantial time and money.
When download staging is needed (new pool workers, cross image transitions, and no locality hits available) we use s5cmd tuned for massive parallel download that is capable of saturating our 10Gbps NICs. I say tuned because total saturation can starve the host’s control plane so a little traffic control is needed. We found this out as we were, briefly, too good at staging - our colocation provider flagged us as a DDoS attack and kept pulling the plug mid-stage. We took it as a compliment, got whitelisted, and cracked on. Overall the result is when staging is necessary, you files rip up to and down from object storage often hitting an enthusiastic 1GiB/s speed.
Transparent Debugging and .exec.err
When we set out to make nf-ccloud, one thing that was top of mind was error visibility. As described in detail in the intro, there is nothing worse than a run failing and having to spend countless hours and brain CPU cycles trying to find the error. When you do eventually find the buried message, it is almost unintelligible. We wanted errors surfaced, understandable language and actionable steps.
The screenshot below shows a failed pipeline. Now see that button that claims to answer the question: “Why?” It does exactly that, tells you why the run failed, rather than handing you a log file and wishing you luck. Plus there is another handy button that copies an LLM prompt you can use right in your head container with Claude to fix whatever went wrong. The LLM debug button contains all the boring details such as the full list of run params, the Nextflow version, the run command, and of course the output from the failed task. Then remember that useful resume command copy button above? Use that.
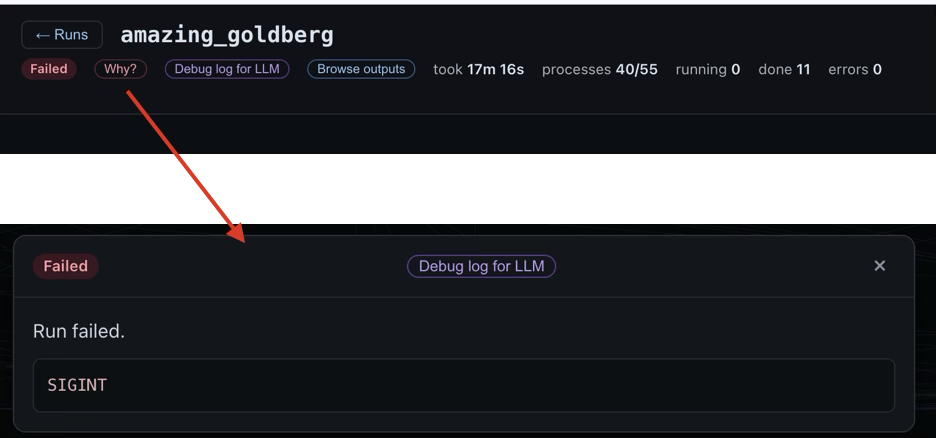
In other words, you hit ctrl+C! This should never come as a surprise
Current users of Nextflow will be familiar with the .command.err log file that captures whatever went wrong inside the task container:
[E::hts_open_format] Failed to open file “sample.bam”
EXITING because of FATAL ERROR in reads input: quality string length is not equal to sequence length
java.lang.OutOfMemoryError: Java heap space
Segmentation fault
But what about the multitude of things that can happen before the task even dispatches? Nextflow doesn’t capture this natively and perhaps these errors are in fact more common. nf-ccloud grabs these errors and surfaces them in a separate .exec.err file, exactly where .command.err is empty and you’d be guessing.
NoSuchBucket: The specified bucket does not exist
SignatureDoesNotMatch: The request signature we calculated does not match
s5cmd: command not found
x509: certificate signed by unknown authority
[ccloud] scratch evict a1b2c3 -> free 4096/51200MB (margin 3072MB)
.exec.err makes these cases diagnosable answering “why didn’t my pipeline run at all?” rather than just “why did my science fail?”
(Un)graceful Shutdown
What happens when you want out? Maybe you used your labs shared storage bucket instead of your own, something your PI hates. You know you should do that ‘graceful shutdown’ thing by measuredly hit Ctrl+C once (just once!) and waiting patiently for the whole pipeline to unwind. But in the midst of panic you mash it several times. Then go and kill your terminal. And just for good measure shut down your laptop. We built for the laptop-in-a-lake scenario, because someone, somewhere, is about to do it.
However, most orchestrated systems clean up by asking the orchestrator (your laptop in this case) to clean up. That works right up until the orchestrator dies badly (at the bottom of a lake) and then tasks are left running to completion while the meter runs. We inverted that: our workers are reaped by the platform not by the head process that created them, triggered by whatever signal and wherever the it came from. For all kinds of orchestrator death, the workers still get torn down and billing still stops within a few minutes with no manual intervention.
Cost you can see
You may have noticed cost coming up a lot. That wasn’t an accident. Carolina Cloud has a core philosophy of price transparency in all services we provide and nf-ccloud is no exception. Trying to find a price per run (a price per anything for that matter) on a big hyperscaler console is near impossible without time-consuming witchcraft (which, as time is money, actually raises the cost!). But that’s a whole blog post in itself.
We make your cost per pipeline run, not just visible, but obvious with live ticking pipeline cost on the DAG UI and a live ticking cost per task on the task drill down tab. This lets you easily find that one process that ate 60% of the run.
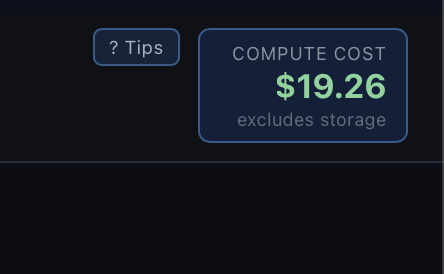
Public demo of this run hosted here
No only is that cost observable but we minimize it in a number of ways; exact resource sizing, sub second spin up times, near-zero idle container cost, pre-flight checks before a lick of billing, fast teardown of all running tasks on any kind of kill event, optimized staging, locality hits and clear reporting of resources used so that next run you can specifically adjust.
Some notes on storage
On the Carolina Cloud Nextflow platform you can choose to create a “Nextflow bucket”. These buckets are optimized for the high churn stress that Nextflow puts on object storage, with no minimum retention period of data, consistent and fast read/write speeds and, of course, absolutely never egress fees. You can then transfer data at will to your longer-term storage in personal or Org buckets.
We also fully support BYOB (bring your own bucket), which can be any S3-compatible source. We will pre-flight check the credentials to verify before anything starts running and billing. If using a Carolina Cloud head container (see Getting Started below) then this bucket will get mounted into that container giving you easy browsing of your workdir and outdir.
But what if I want to use public data stored in open AWS data buckets or an HTTP/FTP source input? Well we wanted that too. We made it so that those endpoints resolve automatically regardless of the endpoint you provide in your config, whether that’s a Carolina Cloud Nextflow bucket, MinIO, Backblaze, R2 or any of the many other warm storage companies that have been popping up recently.
Getting Started
Are you ready to start blasting through tasks like a caffeinated tornado? nf-ccloud is now on the Nextflow registry so you can pull it onto any machine you choose to run your main.nf script from. All you need extra in your config file is a scoped pipeline token, minted on the Carolina Cloud dashboard, nf-ccloud@<version> in your plugins option, process.executor as ccloud and our endpoint url. All pipelines run with nf-ccloud will come with the beautiful DAG UI visible from the console.
Alternatively you can use our browser-based Nextflow Head Container created on the Carolina Cloud console, which comes with some helpful goodies. These are right sized to hold the Nextflow JVM (but can be instantly live resized if you are doing anything extra) and you can drop your Anthropic API key in on creation to give you Claude all setup to help debug. We even include a CLAUDE.md with tips specific to Carolina Cloud.
The above extra configs, including preflight checked bucket credentials and a pipeline token, are put in a baked in config, so you don’t have to worry about getting those parts right. All you need are any extra configs you want and a run script/command.
Try opening a head container and immediately running nextflow run nf-core/rnaseq -profile test to see what happens.
Some Final Thoughts and Request
As a final note I’d like to highlight that there is a perverse incentive out there for the cloud orchestrators where the longer your run takes, the more they get paid. Maybe by reading this post you can believe me when I say, we are not like that. We made it faster and cheaper, which from an investor’s point of view (we have only one investor: ourselves) a genuinely odd thing to brag about, since it means you pay us less. Just how much faster and cheaper I’ll be showing with detailed benchmarks in the twin blog post.
I am both excited and nervous to let our captive executor out into the wild, but I know its the best place for it.
But one more thing that we need help on is the name. The plugin is nf-ccloud but “the Carolina Cloud custom executor” is what we call it when we’re being professional. Pretty long, dry and boring. I’m fielding readers for cool names - comment, email, contact me by all the channels with your ideas! Thanks for reading.